Pillar 06
Sais where you're heading and where you stand
The goal simulator tells you how many touchpoints/week you need to hit your revenue. The stats show in real time whether you're on track. No spreadsheet, no mental math.
Why it matters
An agent who doesn't know how many touchpoints to make per week is flying blind. Referys works back up the chain revenue → transactions → listings → meetings → touchpoints, and shows you in real time where you stand.
Here's what it looks like
Your goals and stats at a glance: revenue, transactions, upcoming listings, remaining touchpoints.
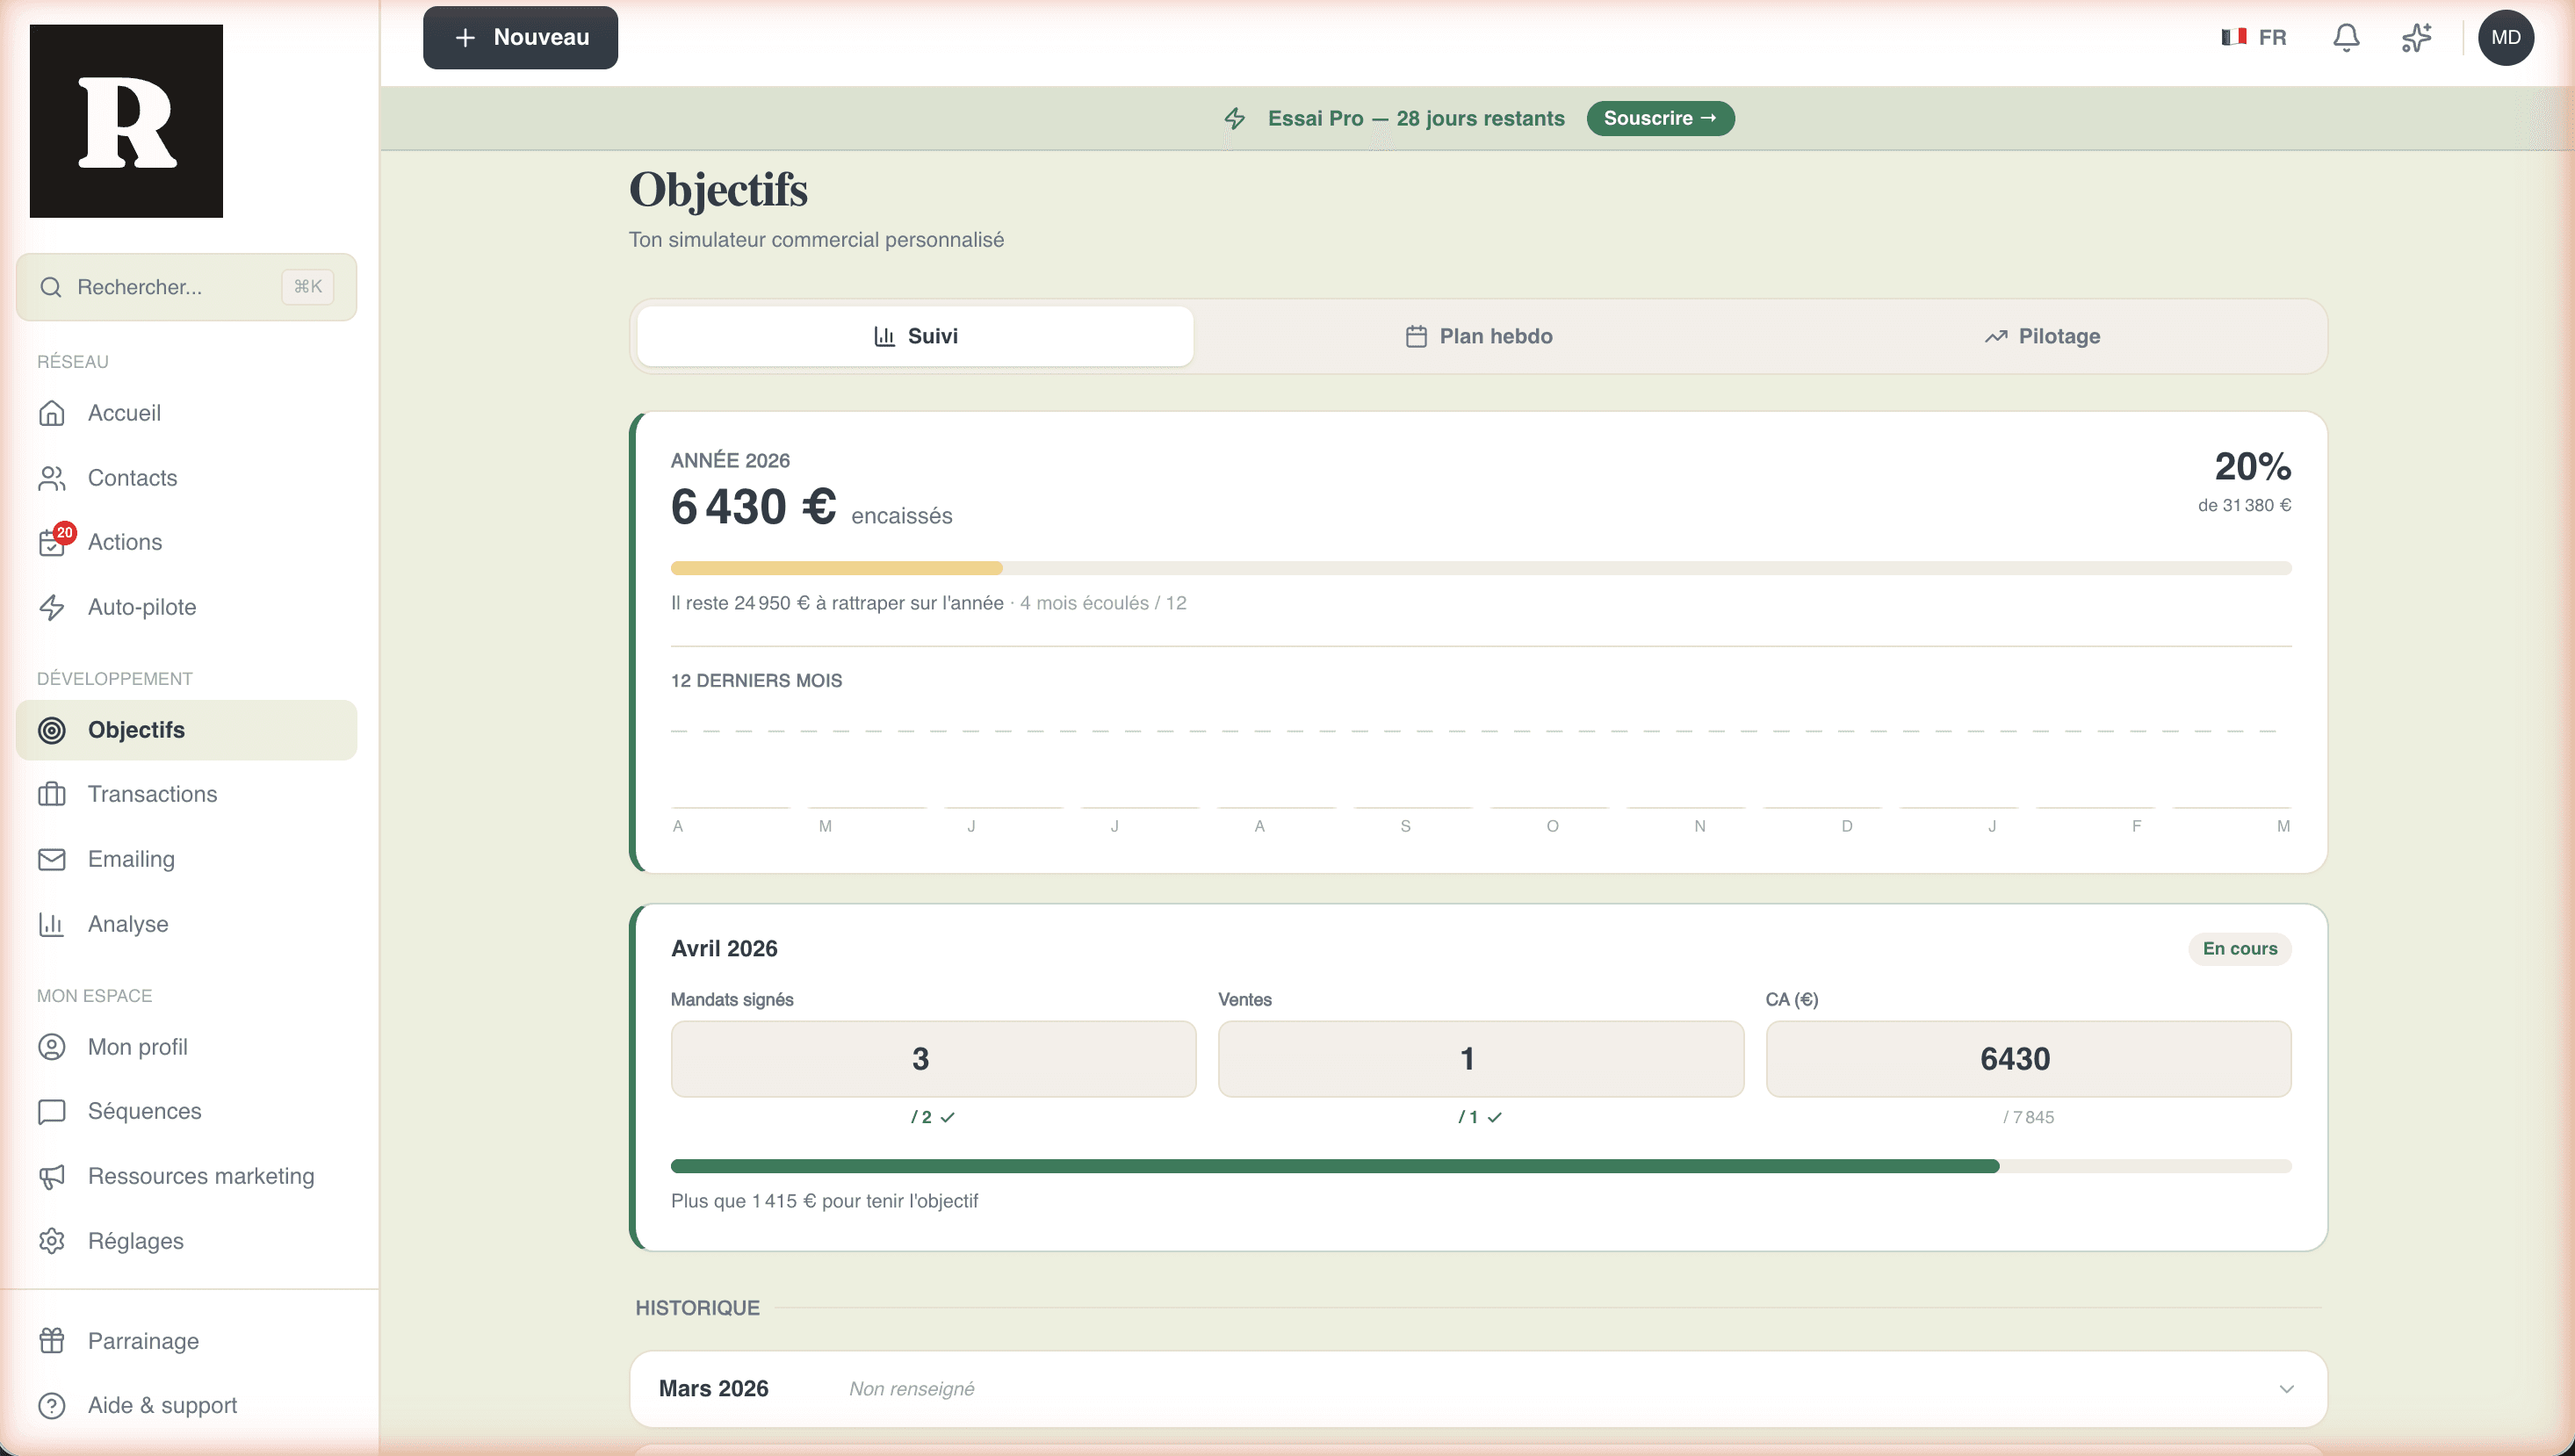
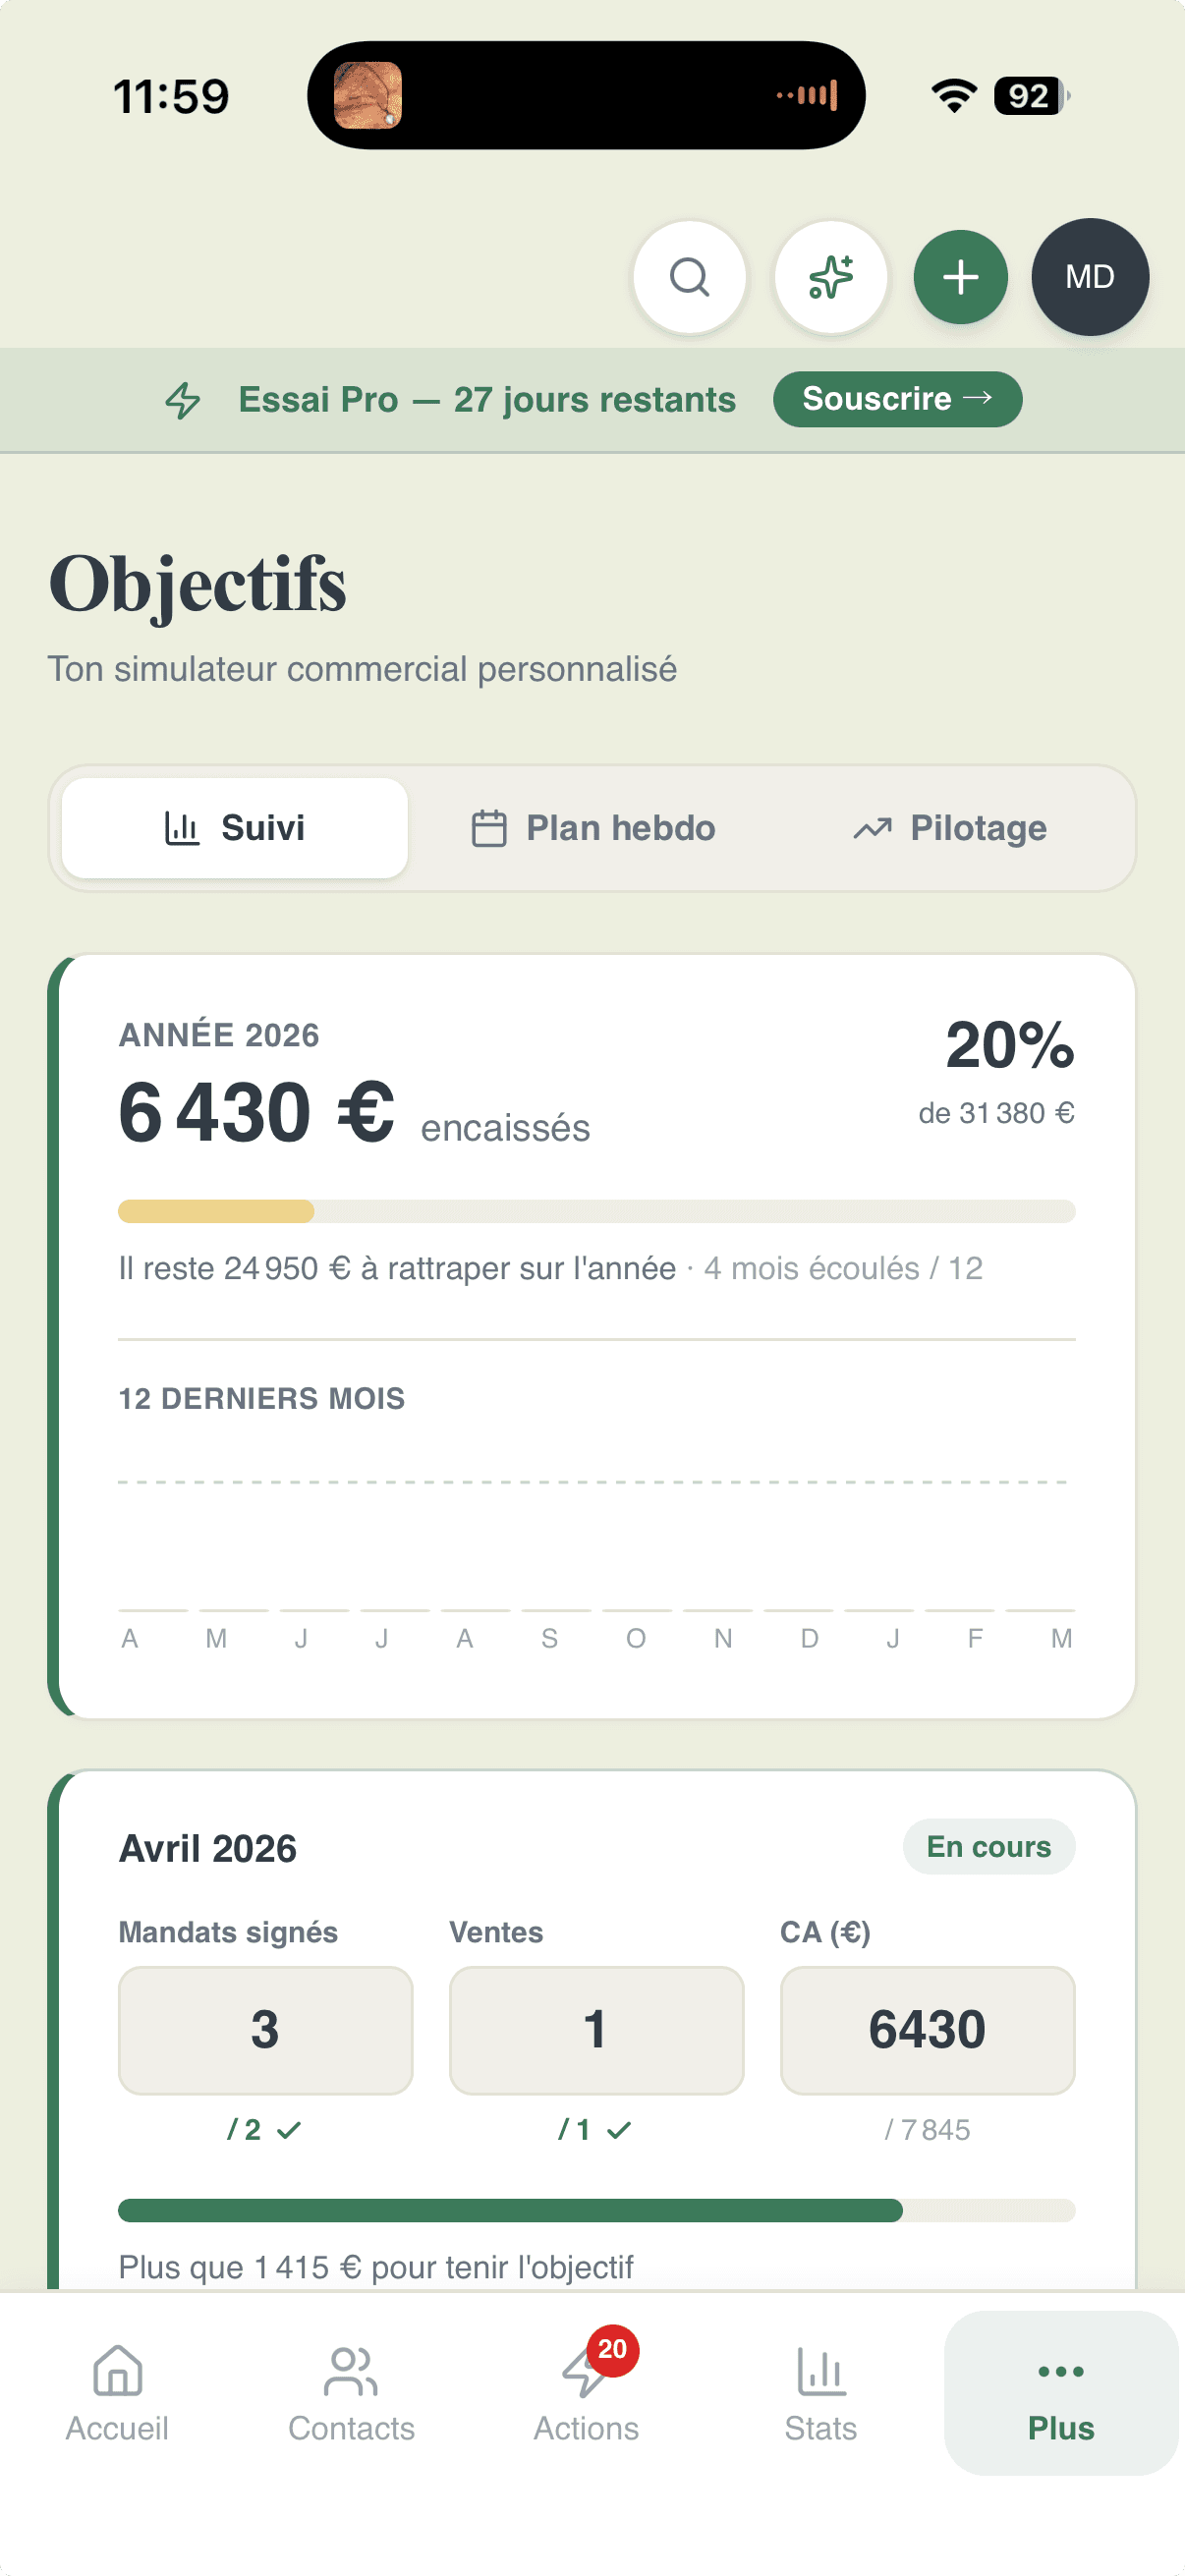
Everything to steer your business
From concrete goals to network health stats, through the annual review.
Agent profile
Self-employed FR, EI, Trabalhador Independente PT, Sociedade Unipessoal PT. Costs, contribution rates, splits, average fees.
Goal simulator
Monthly revenue goal → transactions to close → listings to sign → meetings to schedule → touchpoints/week needed. The full chain.
Progressive refinement
Adjust each parameter (conversion rate, weeks worked, channel mix) and see the impact live.
Monthly revenue tracking
Log every month: revenue earned, transactions closed, listings signed. The history shows the trend vs your target.
Network health across 4 levels
Confirmed networker, Active network, In progress, To develop. You see in one glance whether you're holding the maintenance pace.
Drill-down and reviews
Filter by segment, period, channel. Detailed quarterly review. AI-generated annual review to close the year.
The calculation chain
From your revenue goal to your weekly plan
The simulator works up the chain in 4 steps. You enter your goal, it outputs the number of touchpoints per week.
Annual revenue goal
You enter your target revenue. With your profile (costs, splits, average fees), Referys calculates the net income it represents.
Transactions to close
From your average fees, the app calculates how many transactions you need to sign over the year to hit that revenue.
Listings and meetings
With your listing → transaction and meeting → listing conversion rates, we work back up the number of listings to sign and meetings to hold.
Touchpoints per week
Across weeks worked in the year, this gives the number of weekly touchpoints needed. Concrete, actionable, in your Actions of the day.
Everything included
- ✓Agent profile FR (Self-employed, EI) and PT (Trabalhador Independente, Sociedade Unipessoal)
- ✓Express simulator and parameter tuning (conversion, weeks, channel)
- ✓Monthly tracking of earned revenue, transactions, listings, with history
- ✓Network health stats across 4 levels with month-over-month trend
- ✓Network breakdown by segment (7-segment chart)
- ✓Drill-down by segment, period (week, month, quarter, year), channel
- ✓Automatic quarterly review on the 1st of every quarter
- ✓AI-generated annual review to close out the year
Frequently asked questions
- How is it different from the public ROI simulator?
- Yes. The public simulator on the site is a marketing tool to estimate potential gain. The one in the app is a real continuous steering tool, integrated with your actual activity.
- Are stats included in Starter?
- No. Advanced stats are in Pro and Unlimited. Starter only gives the basic network module.
- What exactly is the annual review?
- An AI-generated end-of-year synthesis: your network activity, your segments, your transactions, your conversion rate, and advice for the year ahead.
- Can I export the stats?
- Yes. CSV export of contacts and interaction history available in Pro and Unlimited.
Steer your business, not your hunches
14 days to calibrate your goals and watch your network health evolve.